When Uptime started charging users for the first time, they did so by using a heavy discount to test the market appetite. We needed to maintain a consistent conversion rate until reaching the full price—a six-fold increase.
Team
This was a team effort. The Growth team consisted of three engineers, a Product Manager, and a Data Analyst.
This is a brief, recruiter-friendly version of the work. Reach out if you’d like to know the full story.
Goals
Uptime helps people learn faster by summarising books, documentaries, courses, and podcasts into 5-minute ‘Hacks.’ We launched with a discounted £9.99/year price, aiming to reach £59.99/year. The challenge was maintaining a stable Conversion Rate (CR) during the transition to full price.
Baseline Conversion
Our launch CR was solid, likely thanks to our unbeatable intro price of £9.99/year.
The real challenge was maintaining it stable through our three upcoming price hikes (£9.99/year → £29.99/year → £39.99/year → £59.99/year). Over this period, we ran hundreds of experiments to optimise the CR. Below is a taster of some of them.
First increase
Note that only a fraction of the experiments are shown.
Bringing the price from £9.99 to £29.99/year decreased our CR by 89%.
We optimised the funnel through a combination of design adjustments and copy optimisation. In this first phase, experiments were based on:
- ideas inspired by other products
- pre-MVP ideas that we left for later
- best practices proposed by our Apple & Google partners.
End of Hack paywall ✅
Looking at data, we noticed gaps in our paywall mapping. We’ve concluded the best time to show a paywall is right after users gain value from the product. One of these moments was finishing a Hack – not a place where we initially added a paywall to not block users from finding something else to consume. Our hypothesis was that people were more likely to pay just after they learned something new. By adding a paywall at the end of a Hack we instantly converted 174% more users.
Gift pop-up ✅
One of our most surprising wins came from reframing the free trial as a gift. Users always got 3 days free, but we tested presenting it differently. We added a paywall after sign-up. If dismissed, a pop-up offered the trial as a ‘gift.’ Same offer, just framed as a gesture, not a default.
I was sceptical, since it meant showing a paywall early. But it worked — conversion rose by 125%, driven by both instant sign-ups and better trial-to-paid rates.
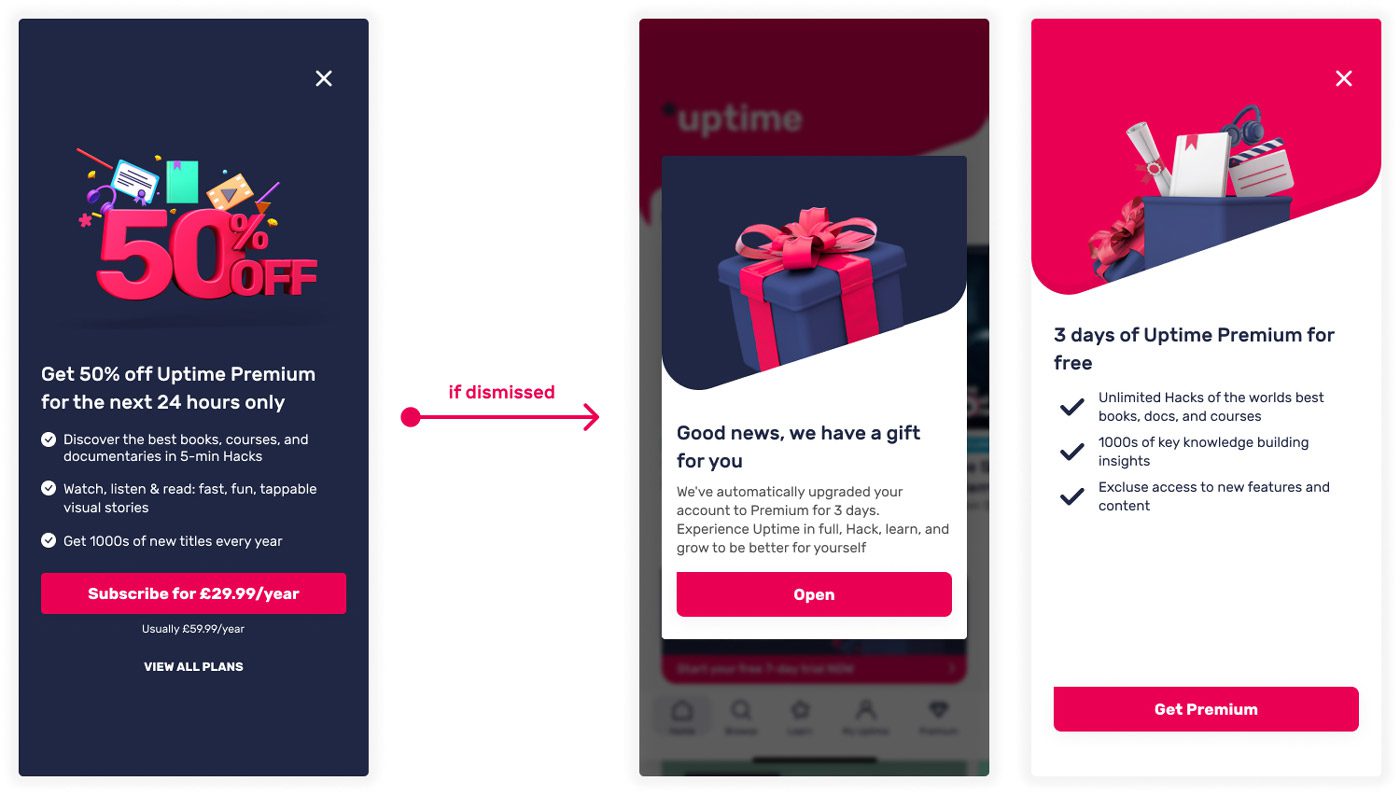
This made users feel good, since it looked like we were gifting them 3 days for free to check out the product.
Second increase
Note that only a fraction of the experiments are shown.
Bringing the price from £29.99 to £39.99/year decreased our CR by 33%.
During the following weeks, rather than focusing on experiments related directly to conversion, we focused mostly on:
- increasing daily usage and retention
- optimising our onboarding and feature discovery
- stacking experiments on top of previous successful ones.
Autoplay ✅
Analytics showed the end-of-Hack paywall worked well, so we aimed to get more users there. We tested AutoPlay, suggesting similar content after a Hack, to drive more completions. It worked — End of Hack sessions rose by 23%, giving us more chances to show the paywall and push Premium.
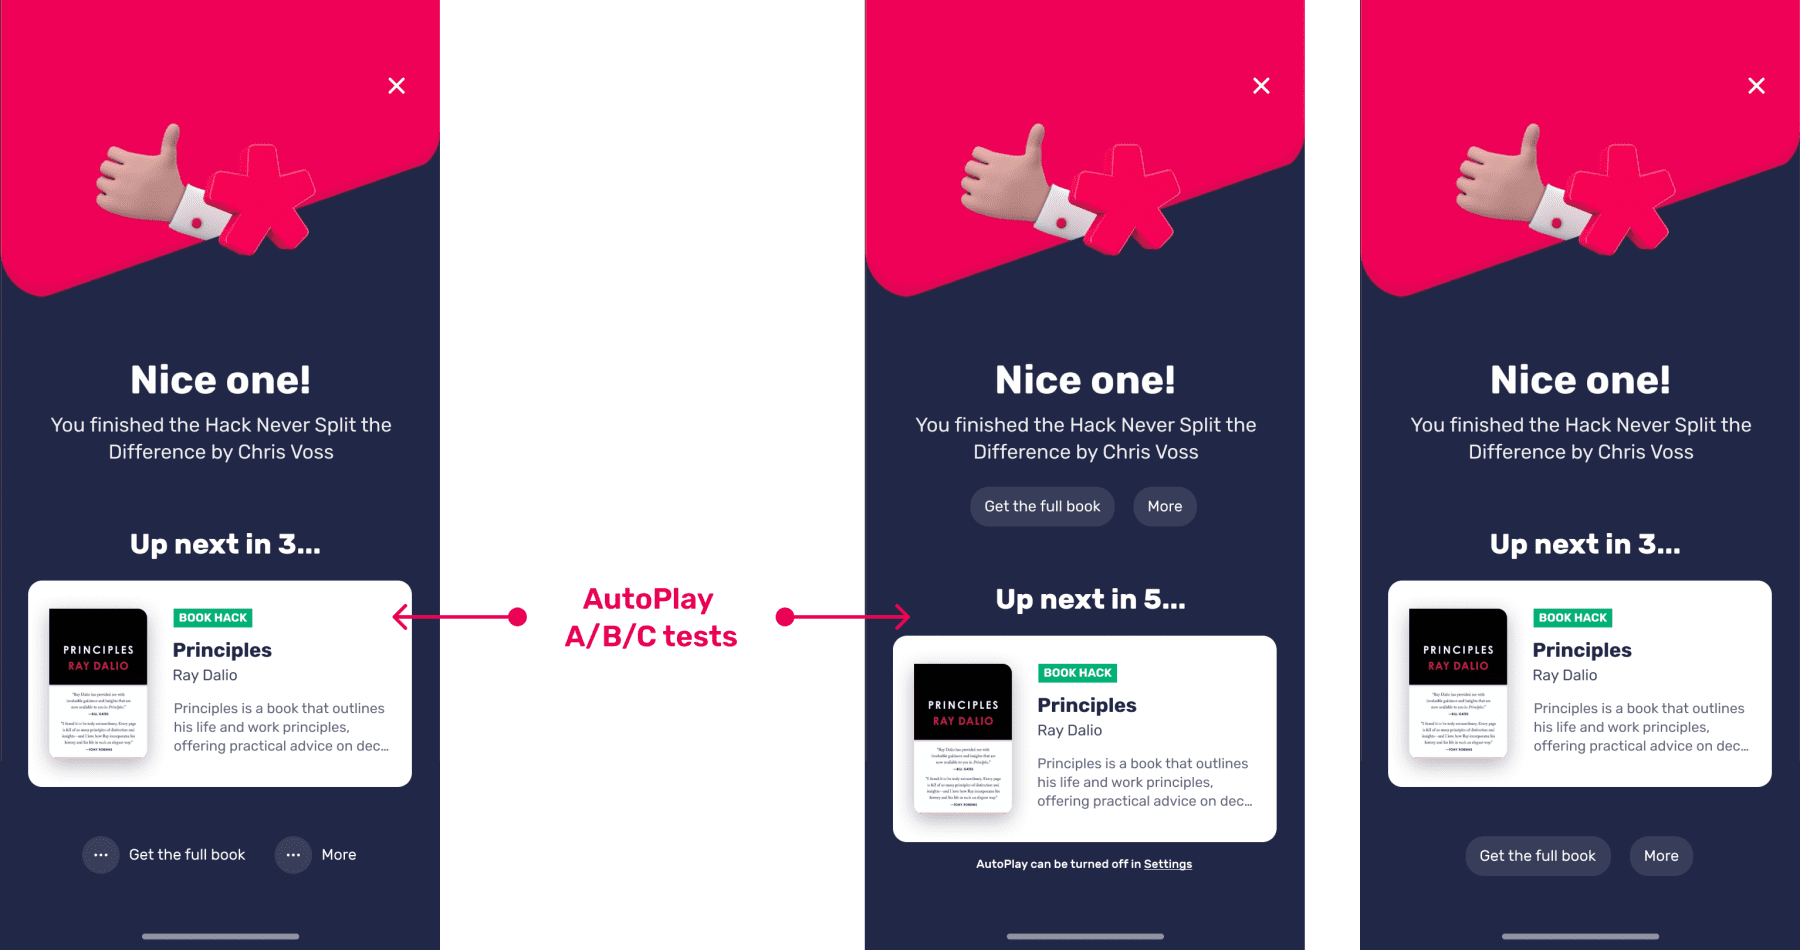
The next Hack plays automatically after a few seconds.
Premium banner ❌
Not all experiments worked. For example, we tried moving the Premium banner to the top of the homepage for Free users, thinking it might drive more upgrades.
The results were flat after two weeks, so we rolled it back since this banner was pushing our most important asset–the content–further down the page. Later usability testing also showed the banner actually hurt trust with users.
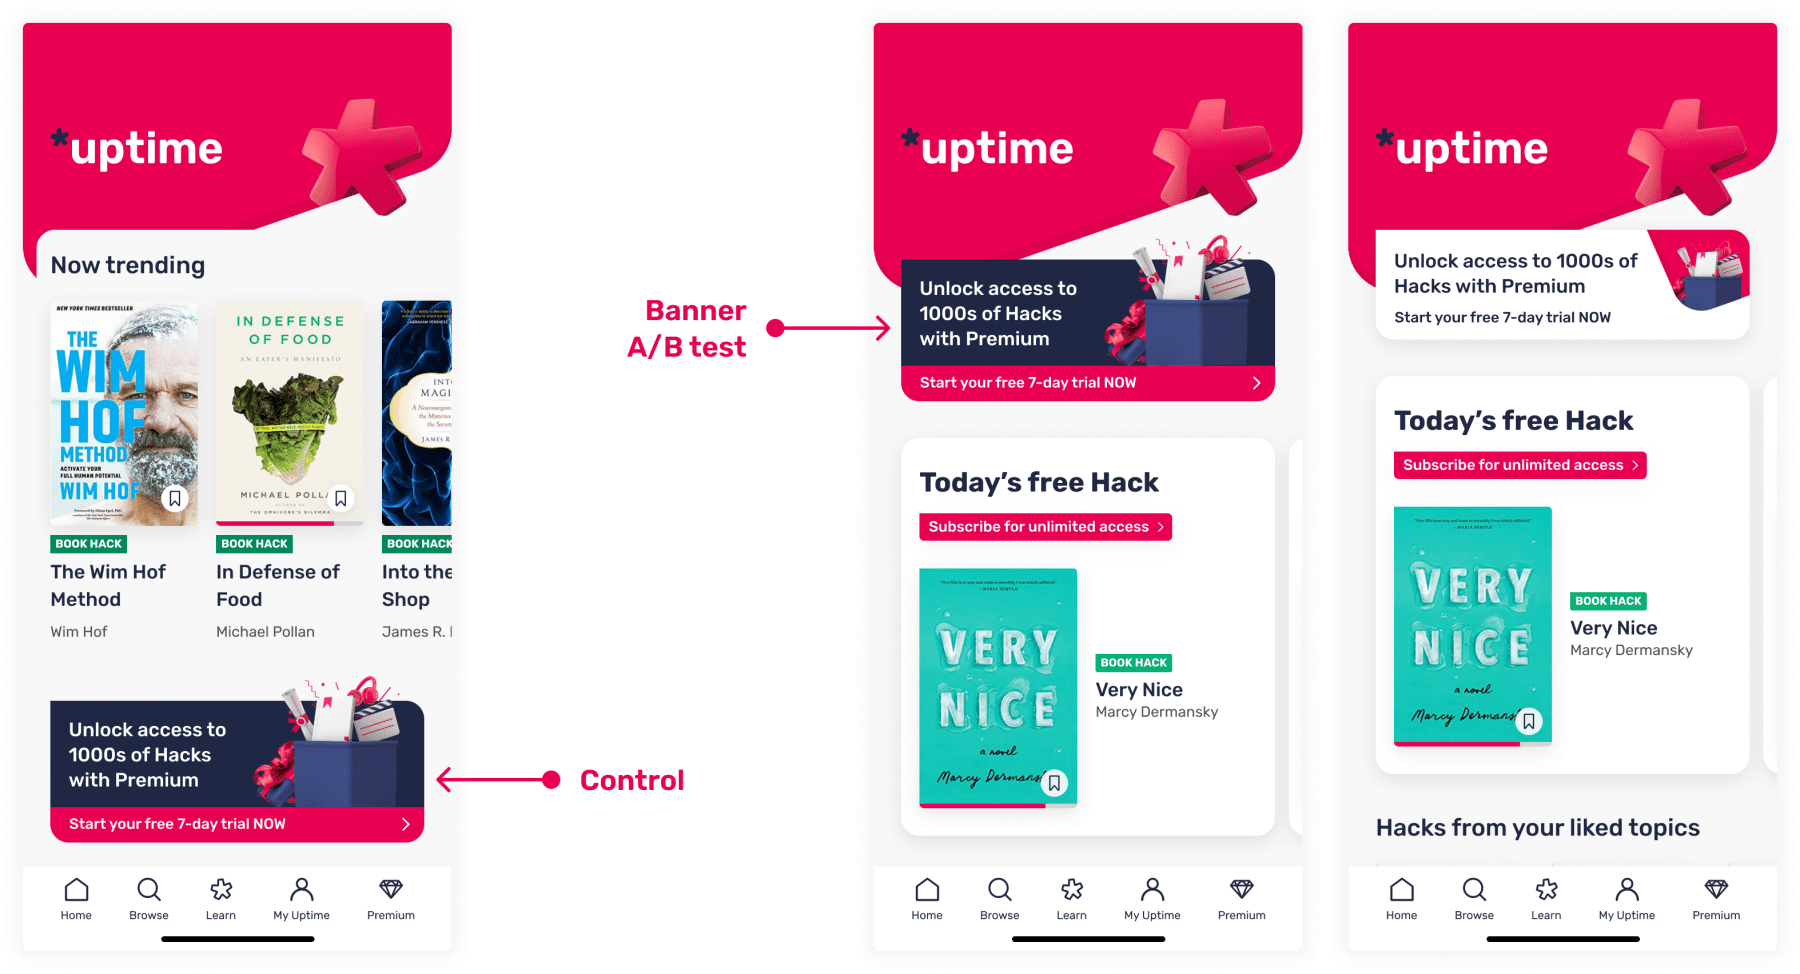
The banner was initially in the second position
Adding it to the top was an unsuccessful experiment, so we rolled back to control.
Third increase
Note that only a fraction of the experiments are shown.
Bringing the price from £39.99 to £59.99/year decreased our CR by 45%.
In this period we focused mostly on experiments higher up the funnel:
- getting more people to open and finish Hacks
- integrating new features
- increasing retention.
Spotlight ✅
Users got the most value from Uptime, which also drove our best conversion, after opening a Hack. So we focused on making that the first thing people did.
Testing showed the next step post onboarding wasn’t clear, which turned about 12% of users away. To fix this, we added a spotlight right after sign-up to explain the app and guide users to a Hack. This led to a 3% lift in new users opening a Hack. A small gain, but it moved us closer to full post-sign-up engagement.
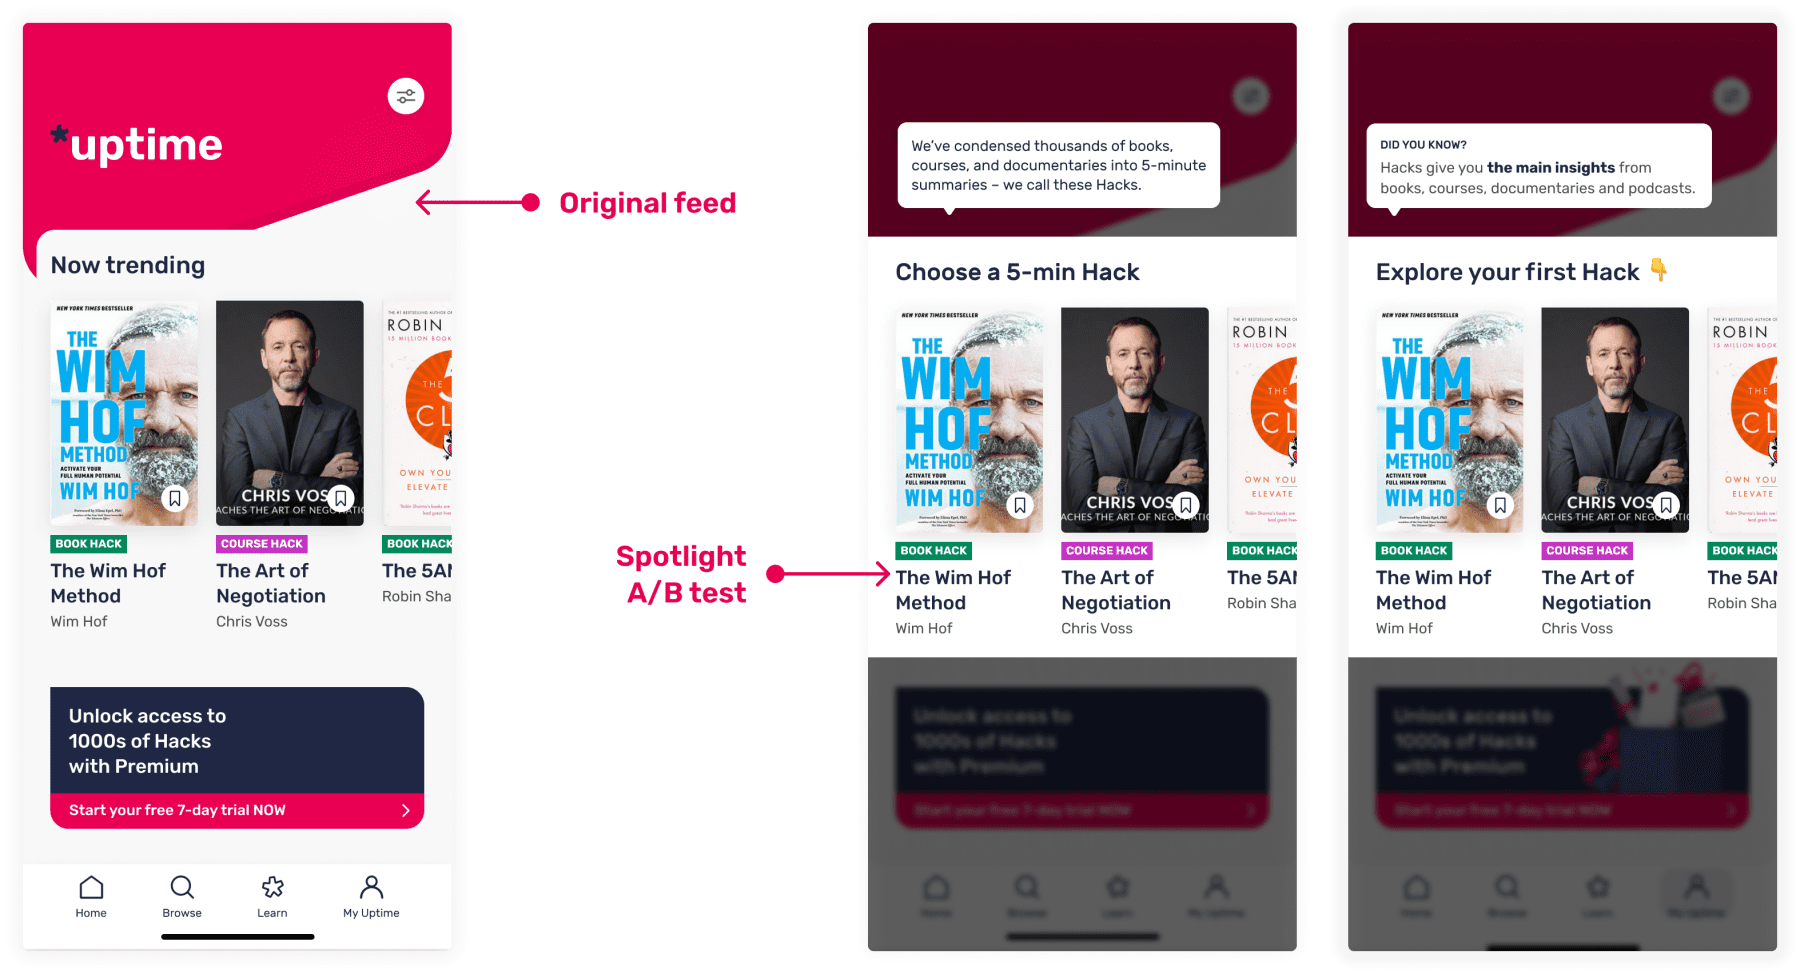
Users were dropped on the feed and had to figure out what to do on their own.
Two variants of the Spotlight test handholding users through their first visit.
Streak completed celebration ✅
Research showed us that users were deeply attached to their streaks, so we hypothesised they’d appreciate reminders to keep them going. We updated the celebration screen’s CTA to prompt notification opt-in. This led to a 686% increase in users setting reminders. As more returned daily to keep their streaks, retention rose by 11.6% — a big win that also boosted conversions later.
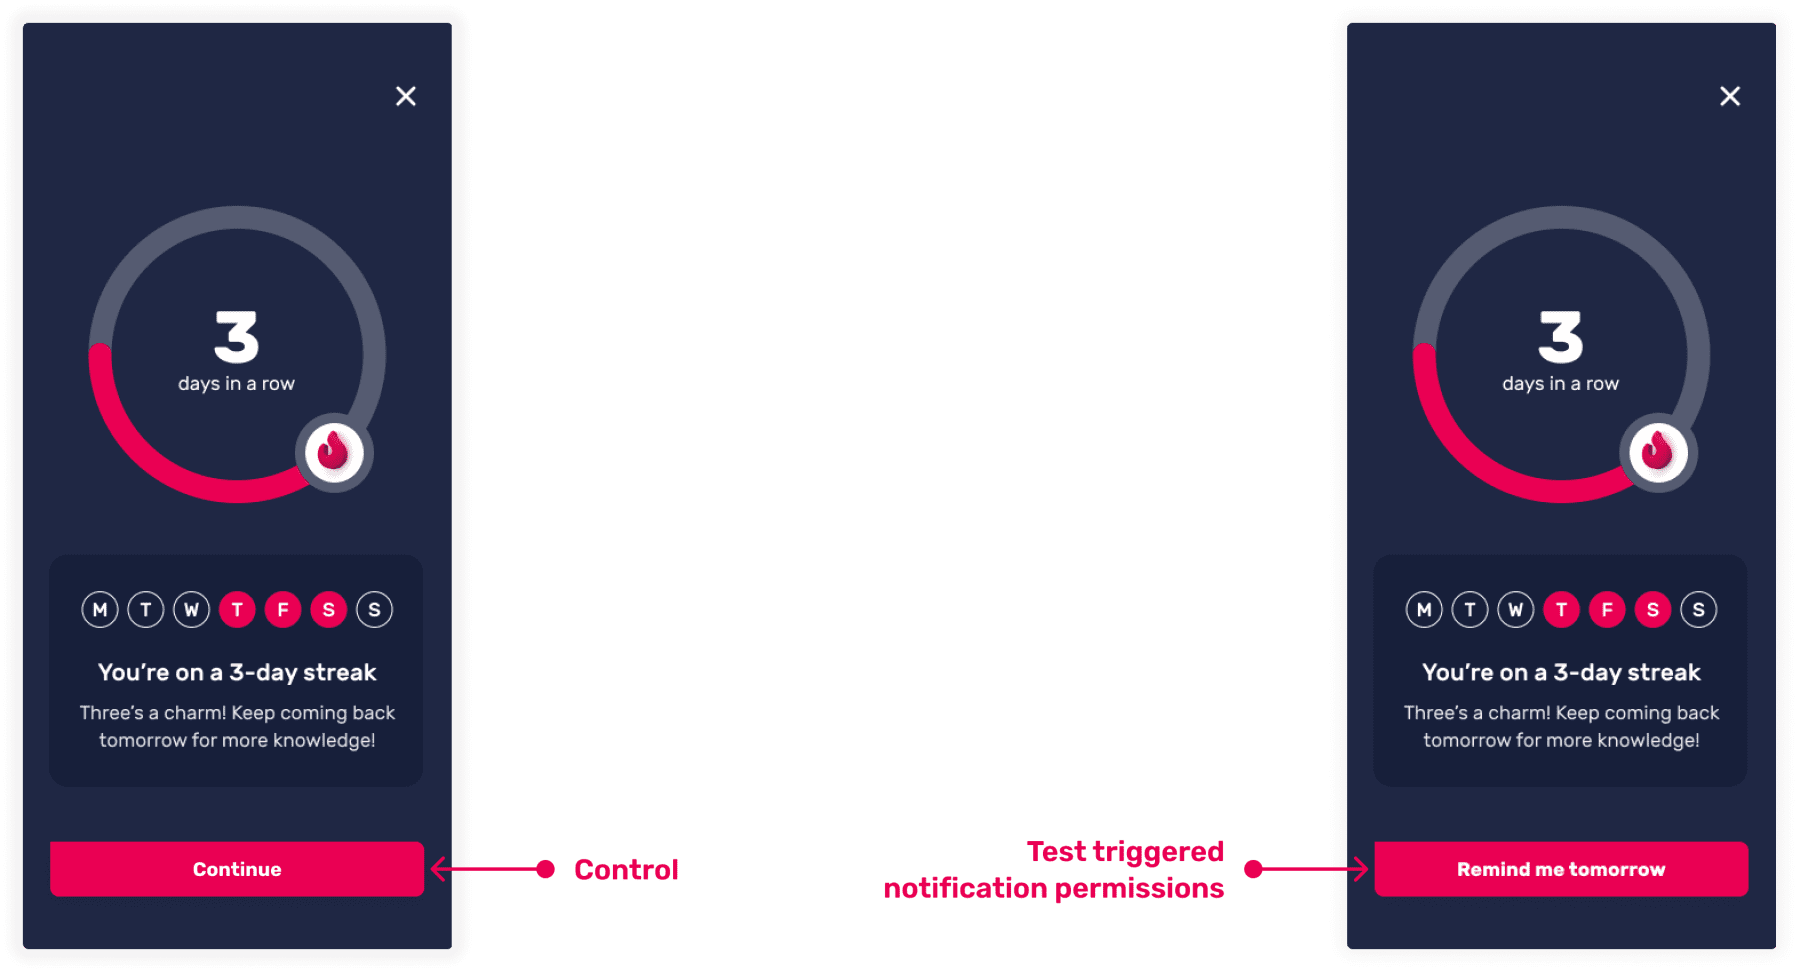
Adding this call-to-action here led to one of our most successful experiments.
Conclusion
After six months of optimisation, we brought the CR back to nearly 100% of baseline, despite a six-fold price increase—a massive win. While we shifted to more strategic, long-term projects, I continued overseeing monetisation efforts throughout my time at the company.